

We’ve been doing case studies with a set of methods of applying ESG to various portfolios to see how they compare to the most common index weighting factor, market cap-weighting. If you haven’t been following along, visit our Insights page and look for the Case Studies graphic to see more.
Meanwhile, check out today’s third study of our simulated Top 1000 Value Index. The first two pitted market cap-weighting as the control against plain ESG-weighting, and ESG-filtering plus ESG-weighting. The chart below shows what happens when that starting universe filters out its sub-median ESG performers then cap-weights.
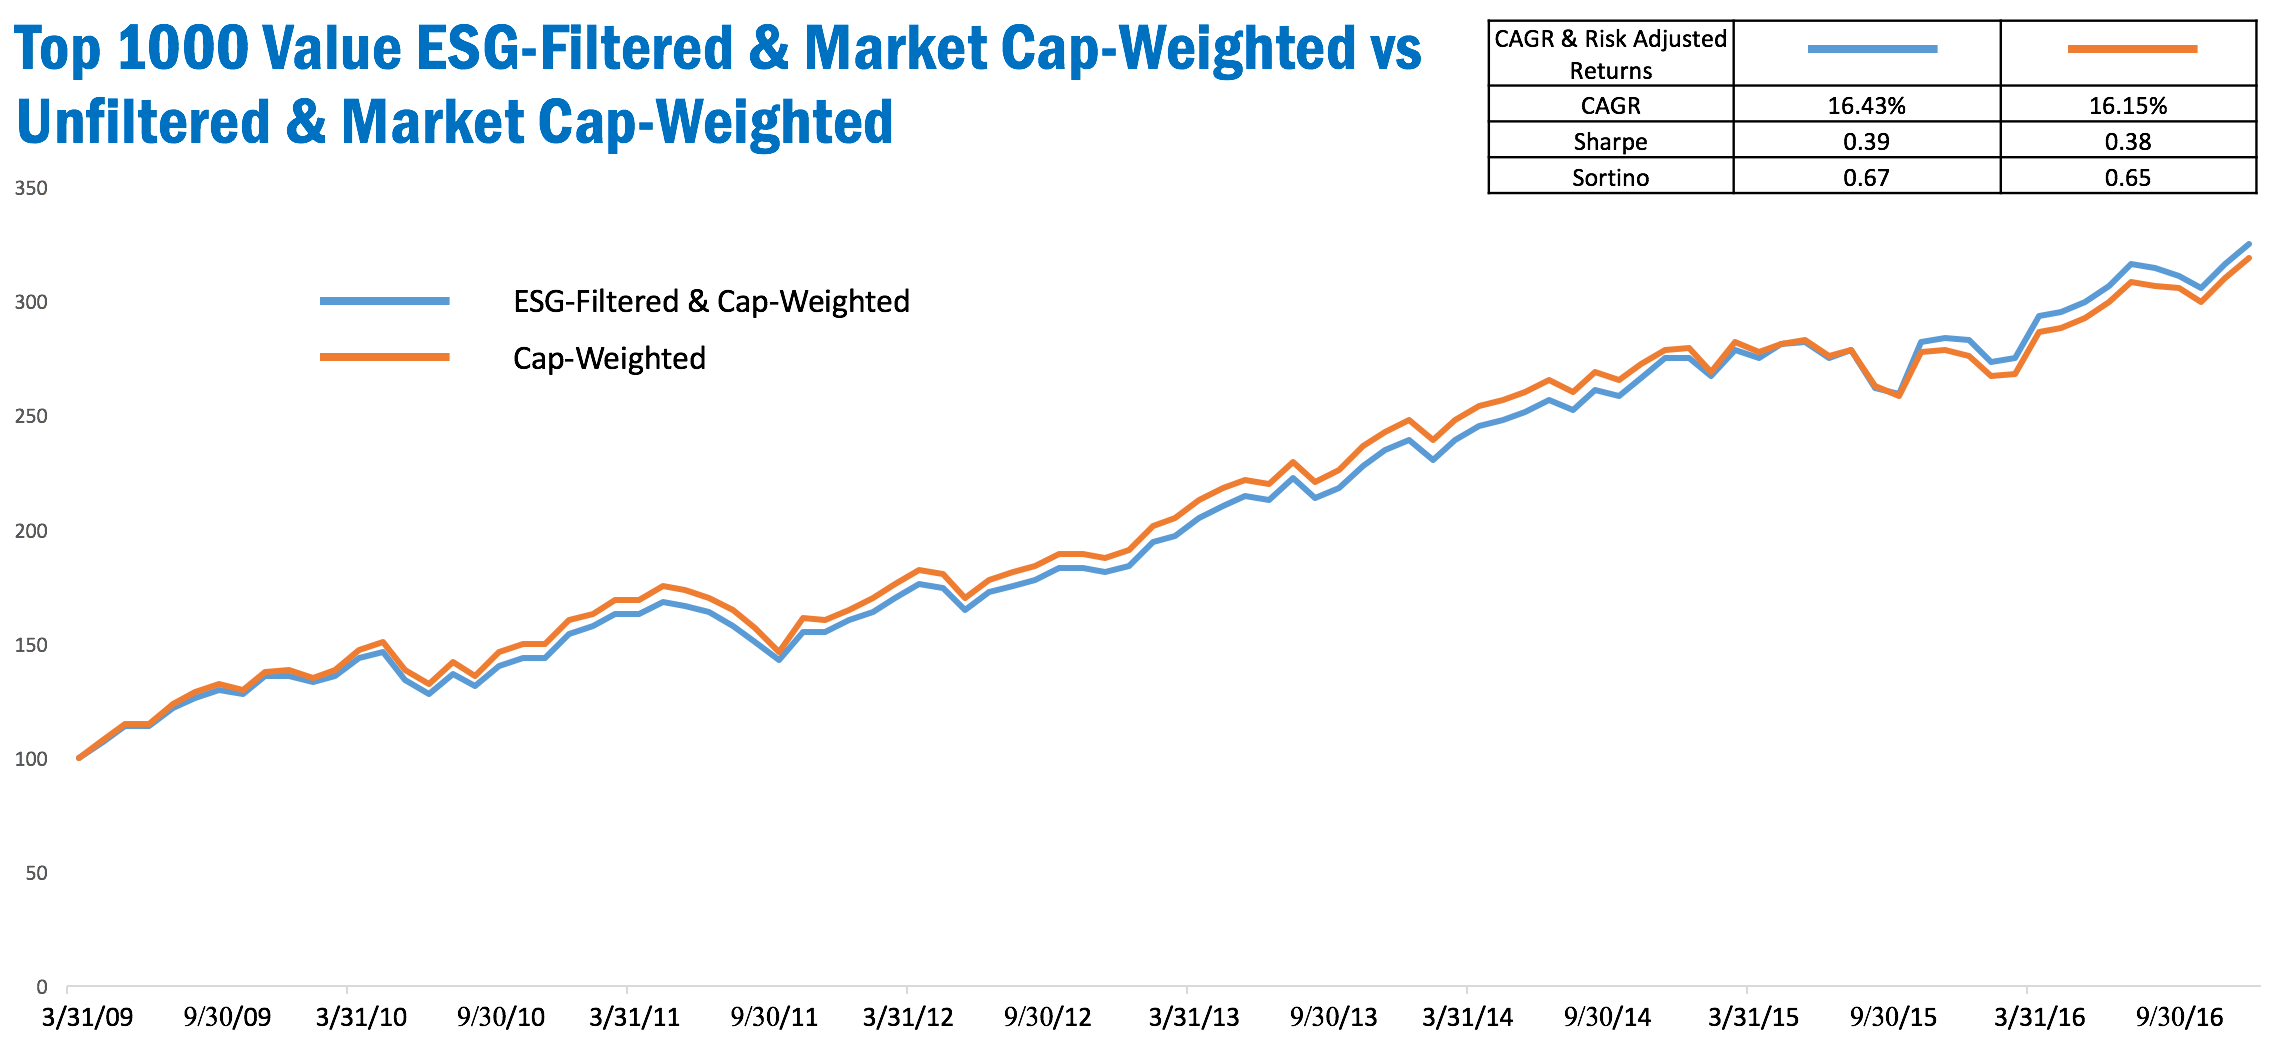
Pew. Once again, filtering by ESG score and cap-weighting doesn’t look like the way to go. It tracks the control closely with minute under- or out-performance. Hardly worth the effort.
If you haven’t been keeping score, the strongest strategy so far seems to be simply weighting by ESG score. But don’t race to rebalance all your investments quite yet! We have a lot more case studies coming your way.
Need more information sooner? Contact us to discuss your particular investment needs, and how ESG might be able to help you.
Disclosure: March 31, 2009 is the date that the OWL ESG historical database begins. The top 1000 US companies are not all covered in the OWL ESG database. Any companies not covered received a weight of 0.00% and their performance is not reflected in the OWL ESG-weighted simulated portfolio. Both portfolios for which the performance is displayed are simulated portfolios; they are non-investible models; there are no investible products tracking them; performance is based on simulated backtests. Factor exposures other than ESG score, such as market capitalization, valuation ratios, and momentum have an effect on performance as well. Past performance is in no way indicative of future results.