

At OWL ESG we do a lot of evangelizing about the benefits of using environmental, social, and governance (ESG) data in investing. Why? Because we’ve seen it at work.
Our head of product development recently re-ran our original ESG case studies with a refreshed data set. The results have only strengthened our conclusions.
Since we’ve been studying ESG so extensively, it’s high time we start sharing results. Watch this space for regular additions to the case study library! Meanwhile, here’s the first of many to come.
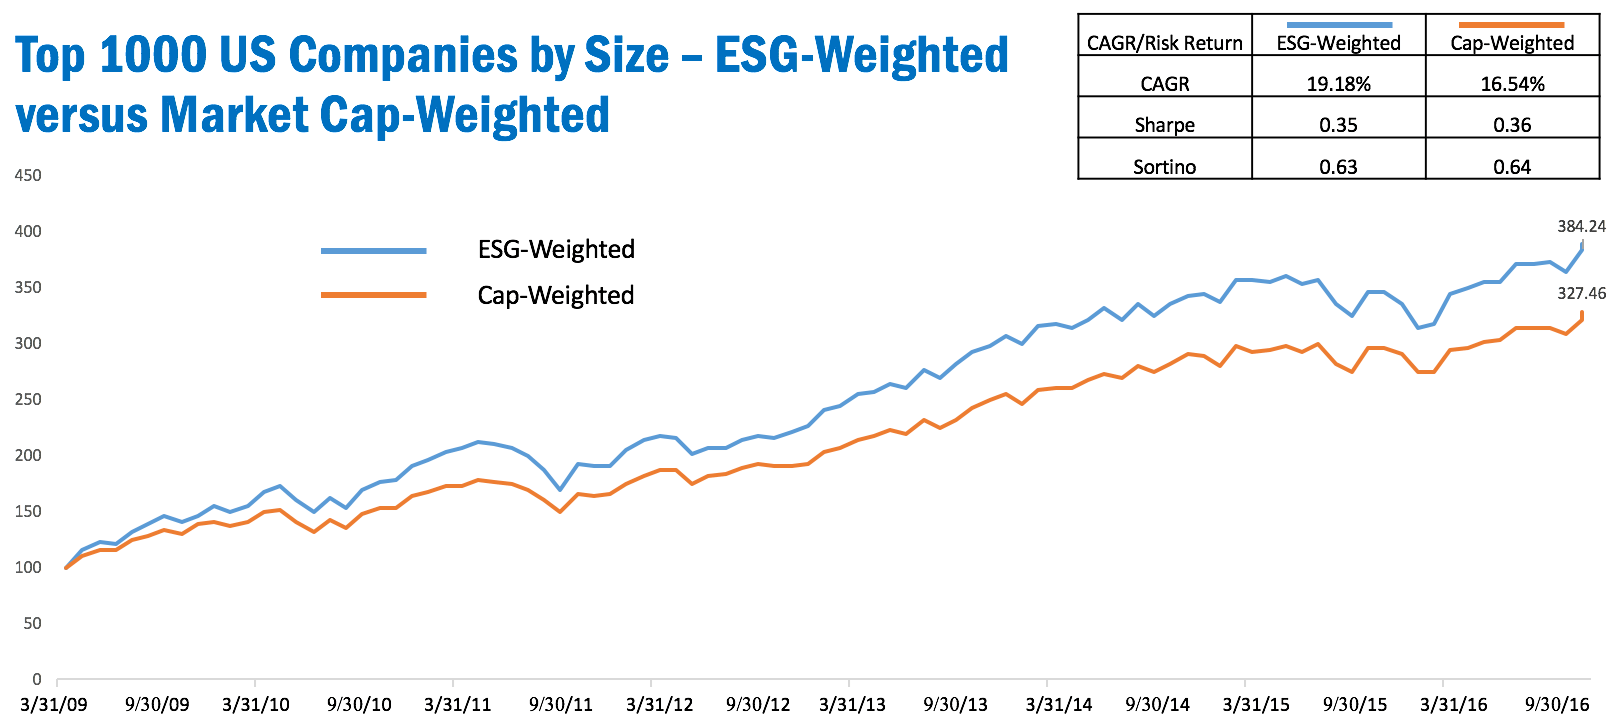
A simulated portfolio comparison of the 1000 largest US companies from March 1, 2009 to December 31, 2016 demonstrates the benefits of OWL ESG-weighting compared to market capitalization-weighting for a domestic large-cap portfolio. Not only did the OWL ESG-weighted version of the portfolio significantly enhance total returns, but also enhanced risk-adjusted returns as measured by both Sharpe and Sortino ratio.
Interestingly, the Sortino ratio, which focuses on downside volatility, demonstrates a greater positive differential than the Sharpe ratio. This suggests that where there is additional volatility it is largely upside volatility, while downside volatility more closely tracks the market capitalization version of the simulated portfolio.
Disclosure: March 31, 2009 is the date that the OWL ESG historical database begins. The top 1000 US companies are not all covered in the OWL ESG database. Any companies not covered received a weight of 0.00% and their performance is not reflected in the OWL ESG-weighted simulated portfolio. Factor exposures other than ESG score, such as market capitalization, valuation ratios, and momentum have an effect on performance as well. Past performance is in no way indicative of future results.