Customize Consent Preferences

We use cookies to help you navigate efficiently and perform certain functions. You will find detailed information about all cookies under each consent category below.

The cookies that are categorized as "Necessary" are stored on your browser as they are essential for enabling the basic functionalities of the site. ... 

Always Active

Necessary cookies are required to enable the basic features of this site, such as providing secure log-in or adjusting your consent preferences. These cookies do not store any personally identifiable data.

No cookies to display.

Functional cookies help perform certain functionalities like sharing the content of the website on social media platforms, collecting feedback, and other third-party features.

No cookies to display.

Analytical cookies are used to understand how visitors interact with the website. These cookies help provide information on metrics such as the number of visitors, bounce rate, traffic source, etc.

No cookies to display.

Performance cookies are used to understand and analyze the key performance indexes of the website which helps in delivering a better user experience for the visitors.

No cookies to display.

Advertisement cookies are used to provide visitors with customized advertisements based on the pages you visited previously and to analyze the effectiveness of the ad campaigns.

No cookies to display.

ESG Case Study: Top 1000 Value

Image from OWL ESG displaying the cover of 'ESG Case Studies

Among our many tests, we made an effort to test our methodology on approximations of popular benchmark indices. This study simulates an ESG-weighted Top 1000 Value portfolio (blue) versus the same portfolio weighted by market-cap (red). Our starting universe is the top 1000 US companies by market-cap that are also in the Wilshire Large- or Mid-Cap Value indices.

Chart: Top 1000 Value, ESG-weighted vs cap-weighted

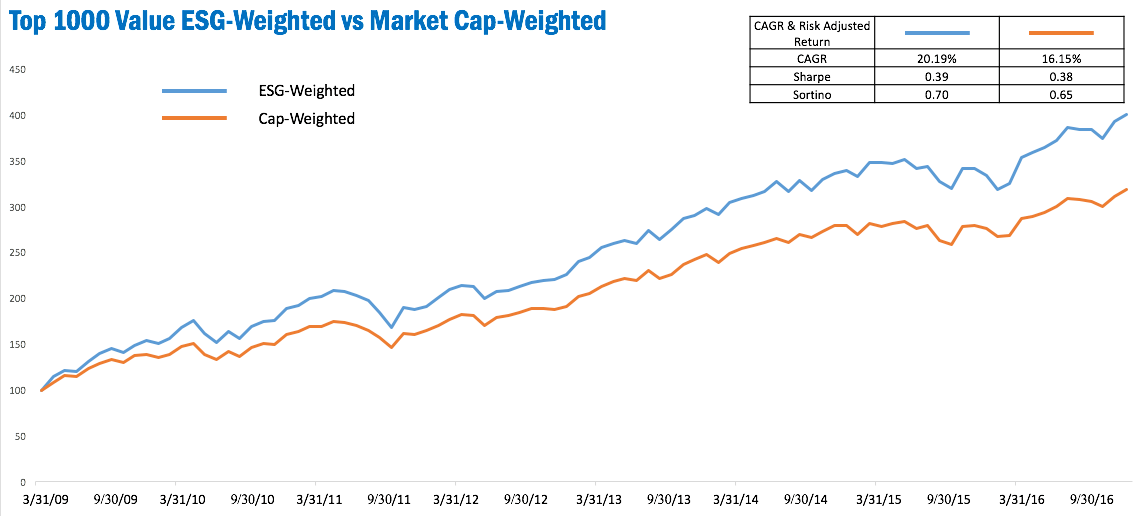
Once again, the ESG-weighted portfolio takes an early lead and keeps climbing. Compared to our second study, the ESG-weighted portfolio shows less increase of risk over its cap-weighted benchmark. Like earlier studies, the ESG-weighted portfolio shows low added risk measured by the Sharpe ratio, but higher upside volatility gauged by the Sortino ratio.

We’re liking the way these ESG-weighted portfolios are looking. Drop us a line and let us know what you think.

Disclosure: March 31, 2009 is the date that the OWL ESG historical database begins. The top 1000 US companies are not all covered in the OWL ESG database. Any companies not covered received a weight of 0.00% and their performance is not reflected in the OWL ESG-weighted simulated portfolio. Both portfolios for which the performance is displayed are simulated portfolios; they are non-investible models; there are no investible products tracking them; performance is based on simulated backtests. Factor exposures other than ESG score, such as market capitalization, valuation ratios, and momentum have an effect on performance as well. Past performance is in no way indicative of future results.