

Give a baseball player signals that predict whether or not the next pitch is likely to be a curveball and there’s a good chance he will significantly improve his batting average (let’s assume there’s no cheating involved).
Similarly, an active equity manager with access to signals about whether key risk factors for a stock are improving or worsening, and whether those factors will likely have a positive or negative effect on alpha over the next 12 months, would have a real (and perfectly legal) advantage.
That’s exactly what OWL and our partner, Confluence Analytics, offer: ESG signals that provide true insights.
Making ESG Signals Useful
Investors have been using fundamental research to pick winners and avoid losers since markets began. Yet, despite the popularity of ESG investing, there has been no clear way to relate ESG research and data to alpha – even though studies clearly show that ESG behavior affects company performance. Simply put, companies that focus on their environmental practices, are responsive to stakeholders, and adhere to good governance principles prosper more than companies that do not. Conversely, companies with poor ESG records are more likely to under perform. In other words, ESG affects returns whether or not an investment strategy explicitly incorporates ESG.
Confluence Analytics uses OWL’s consensus-based ESG metrics to identify key performance indicators (KPIs) that explain a portion of stock returns in excess of market- and sector-driven factors. The model then predicts which stocks are likely to deliver positive ESG-related alpha, and which are likely to under perform going forward.
Transforming Data into Signals
To connect raw ESG data to future excess returns, Confluence Analytics uses advanced statistical and machine learning techniques. The model identifies the KPIs that…
- explain ESG-driven excess returns historically,
- predict future ESG rankings,
- identify stocks with positive and negative forward-looking alpha signals.
Based on the performance indicators that have explanatory power with respect to excess returns, the model predicts how those KPIs are likely to change in the coming months. Then, forward-looking KPI predictions are used to compute forward-looking alpha signals.
Here, we review the US Universe to see how our Forecasts of ESG KPIs & Alpha Signals fared recently. The table below provides the results:
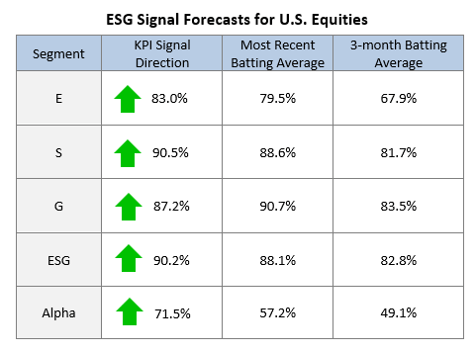
The KPI Signal Direction shows the percentage of ESG-related KPIs that are expected to improve next month, and the percentage of alpha signals derived from those KPIs that are positive. Here, the majority of companies have positive signals in each category and over 50% of alpha signals are positive, so all of the arrows are green.
The Batting Averages show the percentage of companies in the universe for which the model has correctly forecasted the direction of the KPIs in the most recent month, and the average of that “success rate” in each of the past three months. The forecast for each KPI in a given month is based on the most recent 12-months of data.
For example, the results show that the model’s most recent predictions regarding the directional change in overall ESG KPIs were correct for 88.1% of companies in the U.S. Equities universe. The model’s directional forecasts in this category each month over the past three months were correct for an average of 82.8% of stocks in the universe.
The results also show the model correctly forecasted whether alpha would be positive or negative in the coming month for 57.2% of stocks. Since ESG is known to affect stock returns, it represents a risk factor to be managed. Often, it is more important to avoid a risky position than to guess which stocks will be winners in a given month or quarter. That’s another reason this approach is so powerful – it forecasts ESG-related risk, and provides clear signals about how those risk exposures are likely to affect alpha.
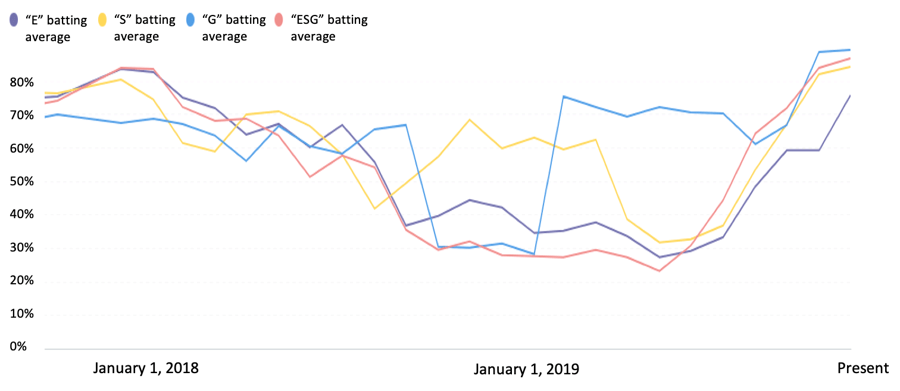
The graph above shows the “batting averages” of the model’s forecasts for E, S, G and ESG KPIs for the U.S. market, for each month over the past 24 months. With expected variations over time, the model consistently forecasted the future direction of KPIs for each category.
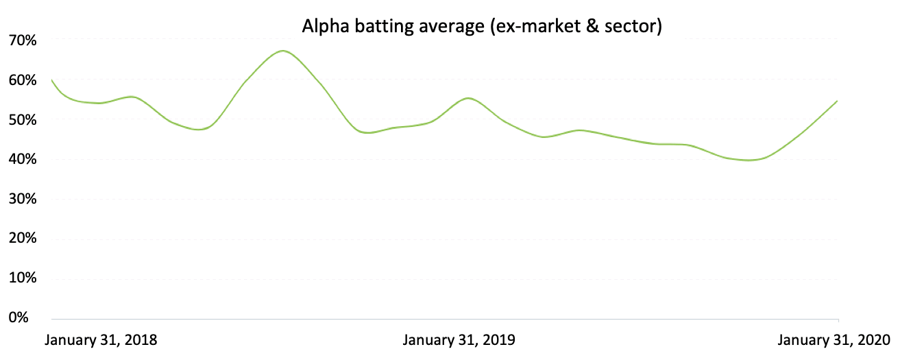
Here, we show the batting averages for our alpha signal over time, where alpha is defined as return in excess of market (beta) and sector effects. Relying only on ESG-related signals, the model has a strong track record of predicting whether or not alpha is likely to be positive in the coming month. Armed with this signal, ESG data becomes a tool for managing risk for any portfolio strategy.
In future articles, we’ll share some interesting insights into the differences in the signals for large, mid- and small-cap stocks, for International stocks, and across each of the three categories of E, S and G.
The Takeaway
Why does this approach work? Because good ESG data reflects things that improve or harm company profitability. The challenge is how to use the information. Relating ESG data to returns offers managers a way to reduce ESG-related risk and maximize the probability of holding stocks whose ESG profiles will contribute to returns. Contrast that with simply holding stocks with high ESG rankings and hoping for the best. It’s the difference between saying “we ‘do’ ESG” and “we use ESG to deliver returns”.
Carrying the baseball metaphor a step further, one of the most valuable things about these signals is that they can help an active manager avoid swinging at bad pitches. That’s a powerful way to greatly reduce the risk of ending the year in the minor leagues.