
BY: Conor Platt & Robert Yates
ESG investing revolves around companies working to improve performance with respect to some set of environmental and/or social factors. Things like greenhouse gas emissions, water preservation, diversity, and labor relations incidents can all be tracked, and a company’s respective performance in those areas feeds into investment decisions for concerned investors.
| What is a metric? A metric is a quantifiable measure that is used to track, compare, and assess performance or processes. What is factor investing? Factor investing is an investment approach that involves targeting specific drivers of return across asset classes. There are two main types of factors: macroeconomic and style. Investing in factors can help improve portfolio outcomes, reduce volatility, and enhance diversification. |
Each of these represents a metric. Individual metrics and sets of metrics are useful to investors concerned with performance in those areas and can be used as part of a basic analysis around things like performance or strategy. ESG data, by and large, are simply structured sets of metrics gathered over time from various sources (surveys, company-level financials, and corporate social responsibility statements, etc.).
While the data is essential, reliance on metrics is limited. Successful investors use available data on pertinent metrics blended with other relevant inputs, such as residual returns (i.e., returns after controlling for macroeconomic or style factors), to create forecasts of both future sustainability and financial metrics. This is the foundation of factor investing, investment strategies that are designed to drive portfolio returns.
As investors pursue both value and values, the importance of ESG metrics, as a measure of performance in potential target or portfolio companies, continues to grow. However, bringing ESG into mainstream investing will require that these metrics are successfully integrated into factor investment strategies.
ESG as a Factor in the Magnificent Seven
Currently, seven companies (the “Magnificent 7” – Apple, Amazon, Nvidia, Meta, Google, Tesla, and Microsoft) dominate financial headlines. These seven companies represent nearly one-third of the market cap of the S&P 500 and generated most of its overall returns, as well, in 2023. Referencing these stocks, we can illustrate how we can move ESG from a metric to a factor and provide a different lens to view the most owned stocks of all time.
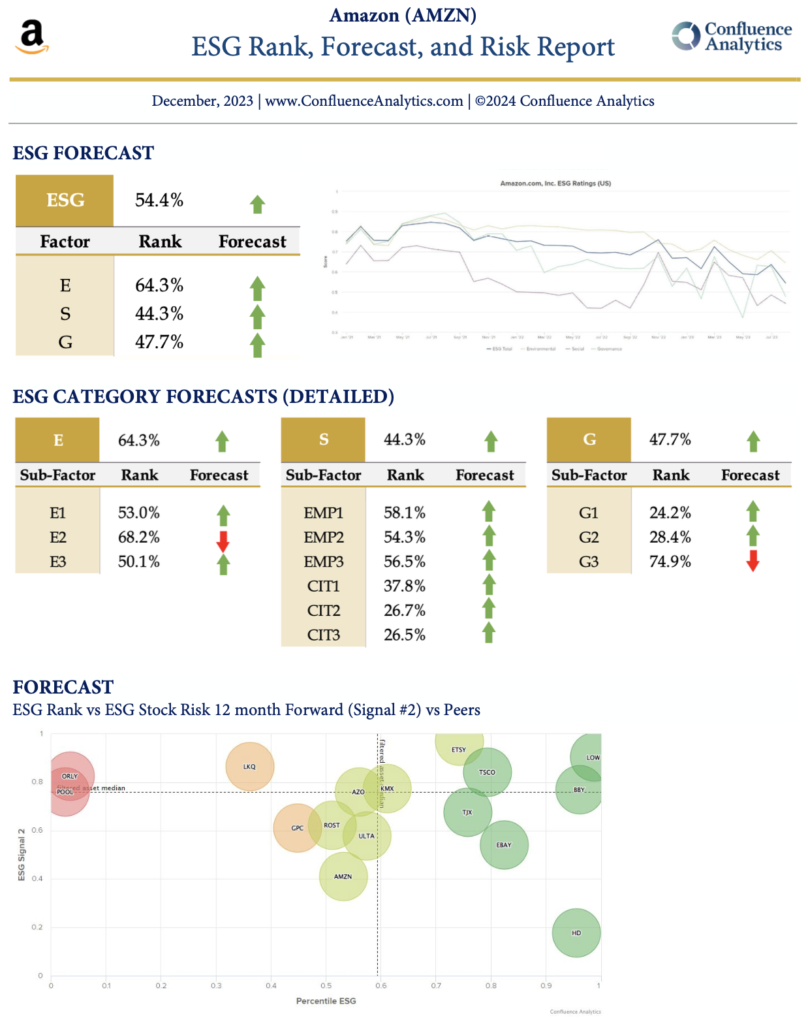
ESG Signal vs ESG Rank for Mag 7
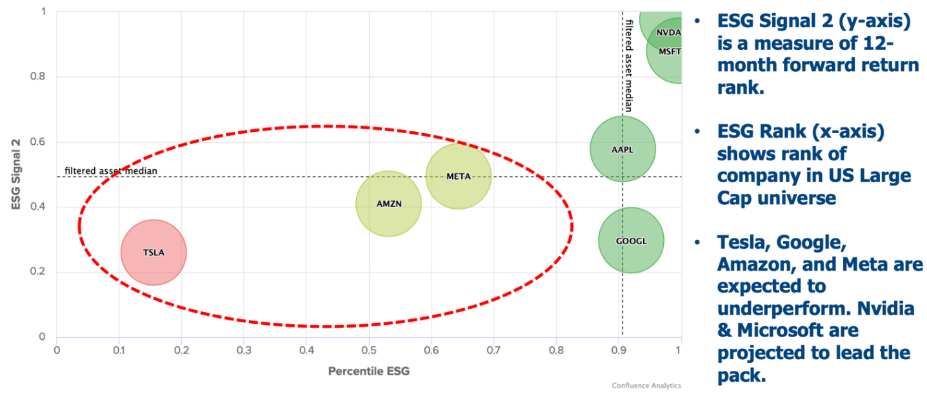
Looking at the chart above, by comparing an ESG metric to its corresponding signal, the metric provides predictable insight into how a specific share might behave, thus enabling factor investing. The power of comparing an ESG metric to its corresponding signal is that it gives investors a way to glean insight into a specific stock from a risk and reward perspective lacking in most ESG offerings.
In this example, for more aggressive traders, the three companies that look like good short candidates are highlighted in the red ellipse above (TSLA, AMZN, META).
Short Risk: Stakeholder Rank vs Signal 2
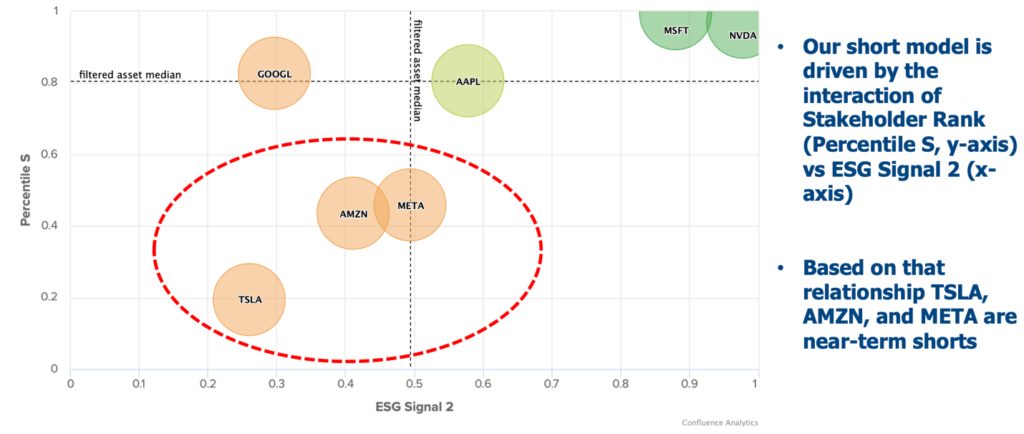
Confluence creates forward-looking estimates of risk and return that can serve to seamlessly integrate these relatively new ESG data sets more with traditional risk management practices.
The method behind this process is not madness, but rather well-understood by most investors. However, combining sustainability and financial forecasts in a fully integrated framework remains an elusive paradigm, especially in mainstream investing.
How We Generate ESG Signals
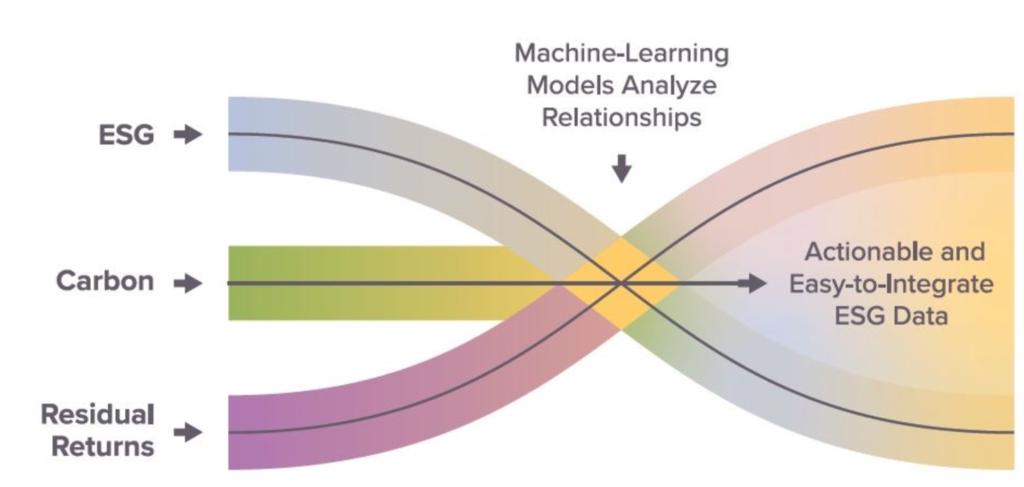
Employing a version of this process to make forecasts and signals results in clarity for investors and analysts when making a forward projection of risk and return from ESG data.
Signals are the most digestible input to an existing investment process as their simple rank output can be judged by the results and integrated as clients see fit for their own process.
Ability to See Forward
Investors often ponder the meaning of ESG rankings and what they really imply. Yet, a more relevant question is, where are the rankings going? All ESG metrics attempt to give a current situation for a company or industry, but few make any predictions or forecasts on where things might go. Through the most accurate, freshest data with transparent, unbiased insights, OWL’s process and tools seek to address this disconnect and close the current ESG and financial forecasting gap.
Our forecasts are a by-product of the signal process illustrated above. Moreover, they’re of immense value for both investors and non-investors alike to make more informed and dynamic decisions as they relate to ESG.